Summary
This C# notebook is a continuation from the previous blog post Predictive Maintenance on .NET Platform.
The notebook is completely implemented on .NET platform using C# Jupyter Notebook and Daany – C# data analytics library. There are small differences between this notebook and the notebooks at the official azure gallery portal, but in most cases, the code follows the steps defined there.
The notebook shows how to use .NET Jupyter Notebook with Daany.DataFrame and ML.NET in order to prepare the data and build the Predictive Maintenance Model on .NET platform.
Description
In the previous post, we analyzed 5 data sets with information about telemetry, data, errors and maintenance as well as failure for 100 machines. The data were transformed and analyzed in order to create the final data set for building a machine learning model for Predictive maintenance.
Once we created all features from the data sets, as a final step we created the label column so that it describes if a certain machine will fail in the next 24 hours due to failure a component1, component2, component3, component4 or it will continue to work.
.
In this part, we are going to perform a part of the machine learning task and start training a machine learning model for predicting if a certain machine will fail in the next 24 hours due to failure, or it will be in functioning normal in that time period.
The model which we are going to build is multi-class classification model sice it has 5 values to predict:
component1,component2,component3,component4 ornone – means it will continue to work.
ML.NET framework as library for training
In order to train the model, we are going to use ML.NET – Microsoft open source framework for Machine Learning on .NET Platform.
First we need to put some preparation codes like:
- Required Nuget packages,
- Set of using statements and code for formatting the output:
At the beggining of this notebook, we installed the several NugetPackages in order to complete this notebook. The following code shows using statements, and method for formatting the data from the DataFrame.
//using Microsoft.ML.Data;
using XPlot.Plotly;
using System;
using System.Collections.Generic;
using System.Drawing;
using System.Linq;

//
using Microsoft.ML;
using Microsoft.ML;
using Microsoft.ML.Data;
using Microsoft.ML.Transforms;
using Microsoft.ML.Trainers.LightGbm;
//
using Daany;
using Daany.Ext;
//DataFrame formatter
using Microsoft.AspNetCore.Html;
Formatter.Register((df, writer) =>
{
    var headers = new List();
    headers.Add(th(i("index")));
    headers.AddRange(df.Columns.Select(c => (IHtmlContent) th(c)));
    //renders the rows
    var rows = new List<List>();
    var take = 20;
    //
    for (var i = 0; i < Math.Min(take, df.RowCount()); i++)
    {
        var cells = new List();
        cells.Add(td(df.Index[i]));
        foreach (var obj in df[i]){
            cells.Add(td(obj));
        }
        rows.Add(cells);
    }
    var t = table(
        thead(
            headers),
        tbody(
            rows.Select(
                r => tr(r))));
    writer.Write(t);
}, "text/html");
Once we install the Nuget packages and define using statements we are going to define a class we need to create an ML.NET pipeline.
The class PrMaintenanceClass – contains the features (properties) we build in the previous post. We need them to define features in the ML.NET pipeline. The second class we defined is PrMaintenancePrediction we used for prediction and model evaluation.
class PrMaintenancePrediction
{
    [ColumnName("PredictedLabel")]
    public string failure { get; set; }
}
class PrMaintenanceClass
{
    public DateTime datetime { get; set; }
    public int machineID { get; set; }
    public float voltmean_3hrs { get; set; }
    public float rotatemean_3hrs { get; set; }
    public float pressuremean_3hrs { get; set; }
    public float vibrationmean_3hrs { get; set; }
    public float voltstd_3hrs { get; set; }
    public float rotatestd_3hrs { get; set; }
    public float pressurestd_3hrs { get; set; }
    public float vibrationstd_3hrs { get; set; }
    public float voltmean_24hrs { get; set; }
    public float rotatemean_24hrs { get; set; }
    public float pressuremean_24hrs { get; set; }
    public float vibrationmean_24hrs { get; set; }
    public float voltstd_24hrs { get; set; }
    public float rotatestd_24hrs { get; set; }
    public float pressurestd_24hrs { get; set; }
    public float vibrationstd_24hrs { get; set; }
    public float error1count { get; set; }
    public float error2count { get; set; }
    public float error3count { get; set; }
    public float error4count { get; set; }
    public float error5count { get; set; }
    public float sincelastcomp1 { get; set; }
    public float sincelastcomp2 { get; set; }
    public float sincelastcomp3 { get; set; }
    public float sincelastcomp4 { get; set; }
    public string model { get; set; }
    public float age { get; set; }
    public string failure { get; set; }
}
Now that we have defined a class type, we are going to implement the pipeline for this ml model.First, we create MLContext with constant seed, so that the model can be reproduced by any user running this notebook. Then we load the data and split the data into train and test set.
MLContext mlContext= new MLContext(seed:88888);
var strPath="data/final_dataFrame.csv";
var mlDF= DataFrame.FromCsv(strPath);
//
//split data frame on training and testing part
//split at 2015-08-01 00:00:00, to train on the first 8 months and test on last 4 months
var trainDF = mlDF.Filter("datetime", new DateTime(2015, 08, 1, 1, 0, 0), FilterOperator.LessOrEqual);
var testDF = mlDF.Filter("datetime", new DateTime(2015, 08, 1, 1, 0, 0), FilterOperator.Greather);
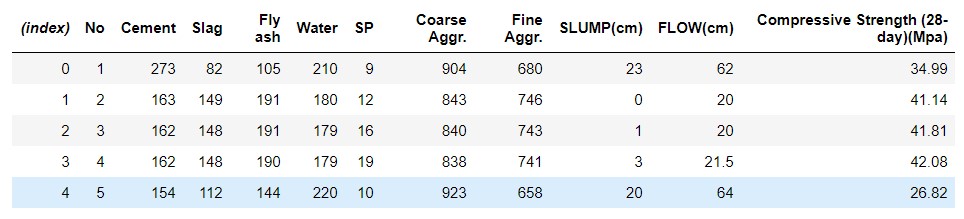
The summary for the training set is show in the following tables:

Similarly the testing set has the following summary:

Once we have data into application memory, we can prepare the ML.NET pipeline. The pipeline consists of data transformation from the Daany.DataFrame type into collection IDataView. For this task, the LoadFromEnumerable method is used.
//Load daany:DataFrame into ML.NET pipeline
public static IDataView loadFromDataFrame(MLContext mlContext,Daany.DataFrame df)
{
    IDataView dataView = mlContext.Data.LoadFromEnumerable(df.GetEnumerator(oRow =>
    {
        //convert row object array into PrManitenance row
        var ooRow = oRow;
        var prRow = new PrMaintenanceClass();
        prRow.datetime = (DateTime)ooRow["datetime"];
        prRow.machineID = (int)ooRow["machineID"];
        prRow.voltmean_3hrs = Convert.ToSingle(ooRow["voltmean_3hrs"]);
        prRow.rotatemean_3hrs = Convert.ToSingle(ooRow["rotatemean_3hrs"]);
        prRow.pressuremean_3hrs = Convert.ToSingle(ooRow["pressuremean_3hrs"]);
        prRow.vibrationmean_3hrs = Convert.ToSingle(ooRow["vibrationmean_3hrs"]);
        prRow.voltstd_3hrs = Convert.ToSingle(ooRow["voltsd_3hrs"]);
        prRow.rotatestd_3hrs = Convert.ToSingle(ooRow["rotatesd_3hrs"]);
        prRow.pressurestd_3hrs = Convert.ToSingle(ooRow["pressuresd_3hrs"]);
        prRow.vibrationstd_3hrs = Convert.ToSingle(ooRow["vibrationsd_3hrs"]);
        prRow.voltmean_24hrs = Convert.ToSingle(ooRow["voltmean_24hrs"]);
        prRow.rotatemean_24hrs = Convert.ToSingle(ooRow["rotatemean_24hrs"]);
        prRow.pressuremean_24hrs = Convert.ToSingle(ooRow["pressuremean_24hrs"]);
        prRow.vibrationmean_24hrs = Convert.ToSingle(ooRow["vibrationmean_24hrs"]);
        prRow.voltstd_24hrs = Convert.ToSingle(ooRow["voltsd_24hrs"]);
        prRow.rotatestd_24hrs = Convert.ToSingle(ooRow["rotatesd_24hrs"]);
        prRow.pressurestd_24hrs = Convert.ToSingle(ooRow["pressuresd_24hrs"]);
        prRow.vibrationstd_24hrs = Convert.ToSingle(ooRow["vibrationsd_24hrs"]);
        prRow.error1count = Convert.ToSingle(ooRow["error1count"]);
        prRow.error2count = Convert.ToSingle(ooRow["error2count"]);
        prRow.error3count = Convert.ToSingle(ooRow["error3count"]);
        prRow.error4count = Convert.ToSingle(ooRow["error4count"]);
        prRow.error5count = Convert.ToSingle(ooRow["error5count"]);
        prRow.sincelastcomp1 = Convert.ToSingle(ooRow["sincelastcomp1"]);
        prRow.sincelastcomp2 = Convert.ToSingle(ooRow["sincelastcomp2"]);
        prRow.sincelastcomp3 = Convert.ToSingle(ooRow["sincelastcomp3"]);
        prRow.sincelastcomp4 = Convert.ToSingle(ooRow["sincelastcomp4"]);
        prRow.model = (string)ooRow["model"];
        prRow.age = Convert.ToSingle(ooRow["age"]);
        prRow.failure = (string)ooRow["failure"];
        //
        return prRow;
    }));

    return dataView;
}
Load the data sets into the app memory:
//Split dataset in two parts: TrainingDataset  and TestDataset
var trainData = loadFromDataFrame(mlContext, trainDF);
var testData = loadFromDataFrame(mlContext, testDF);
Prior to start training we need to process that data, so that we encoded all non-numerical columns into numerical columns. Also we need to define which columns are going to be part of the Featuresand which one will be label. For this reason we define PrepareData method.
public static IEstimator PrepareData(MLContext mlContext)
{
    //one hot encoding category column
    IEstimator dataPipeline =

    mlContext.Transforms.Conversion.MapValueToKey(outputColumnName: "Label", inputColumnName: nameof(PrMaintenanceClass.failure))
    //encode model column
    .Append(mlContext.Transforms.Categorical.OneHotEncoding("model",outputKind: OneHotEncodingEstimator.OutputKind.Indicator))

    //define features column
    .Append(mlContext.Transforms.Concatenate("Features",
    //
    nameof(PrMaintenanceClass.voltmean_3hrs), nameof(PrMaintenanceClass.rotatemean_3hrs),
    nameof(PrMaintenanceClass.pressuremean_3hrs),nameof(PrMaintenanceClass.vibrationmean_3hrs),
    nameof(PrMaintenanceClass.voltstd_3hrs), nameof(PrMaintenanceClass.rotatestd_3hrs),
    nameof(PrMaintenanceClass.pressurestd_3hrs), nameof(PrMaintenanceClass.vibrationstd_3hrs),
    nameof(PrMaintenanceClass.voltmean_24hrs),nameof(PrMaintenanceClass.rotatemean_24hrs),
    nameof(PrMaintenanceClass.pressuremean_24hrs),nameof(PrMaintenanceClass.vibrationmean_24hrs),
    nameof(PrMaintenanceClass.voltstd_24hrs),nameof(PrMaintenanceClass.rotatestd_24hrs),
    nameof(PrMaintenanceClass.pressurestd_24hrs),nameof(PrMaintenanceClass.vibrationstd_24hrs),
    nameof(PrMaintenanceClass.error1count), nameof(PrMaintenanceClass.error2count),
    nameof(PrMaintenanceClass.error3count), nameof(PrMaintenanceClass.error4count),
    nameof(PrMaintenanceClass.error5count), nameof(PrMaintenanceClass.sincelastcomp1),
    nameof(PrMaintenanceClass.sincelastcomp2),nameof(PrMaintenanceClass.sincelastcomp3),
    nameof(PrMaintenanceClass.sincelastcomp4),nameof(PrMaintenanceClass.model), nameof(PrMaintenanceClass.age) ));

    return dataPipeline;
}
As can be seen, the method converts the label column failure which is a simple textual column into categorical columns containing numerical representation for each different category called Keys.
Now that we have finished with data transformation, we are going to define the Train method which is going to implement ML algorithm, hyper-parameters for it and training process. Once we call this method the method will return the trained model.
//train method
static public TransformerChain Train(MLContext mlContext, IDataView preparedData)
{
    var transformationPipeline=PrepareData(mlContext);
    //settings hyper parameters
    var options = new LightGbmMulticlassTrainer.Options();
    options.FeatureColumnName = "Features";
    options.LearningRate = 0.005;
    options.NumberOfLeaves = 70;
    options.NumberOfIterations = 2000;
    options.NumberOfLeaves = 50;
    options.UnbalancedSets = true;
    //
    var boost = new DartBooster.Options();
    boost.XgboostDartMode = true;
    boost.MaximumTreeDepth = 25;
    options.Booster = boost;

    // Define LightGbm algorithm estimator
    IEstimator lightGbm = mlContext.MulticlassClassification.Trainers.LightGbm(options);

    //train the ML model
    TransformerChain model = transformationPipeline.Append(lightGbm).Fit(preparedData);

    //return trained model for evaluation
    return model;
}
Training process and model evaluation
Since we have all required methods, the main program structure looks like:
//prepare data transformation pipeline
var dataPipeline = PrepareData(mlContext);

//print prepared data
var pp = dataPipeline.Fit(trainData);
var transformedData = pp.Transform(trainData);

//train the model
var model = Train(mlContext, trainData);
Once the Train method returns the model, the evaluation phase started. In order to evaluate model, we perform full evaluation with training and testing data.
Model Evaluation with train data set
The evaluation of the model will be performed for training and testing data sets:
//evaluate train set
var predictions = model.Transform(trainData);
var metricsTrain = mlContext.MulticlassClassification.Evaluate(predictions);

ConsoleHelper.PrintMultiClassClassificationMetrics("TRAIN DataSet", metricsTrain);
ConsoleHelper.ConsoleWriteHeader("Train DataSet Confusion Matrix ");
ConsoleHelper.ConsolePrintConfusionMatrix(metricsTrain.ConfusionMatrix);
The model evaluation output:
************************************************************
*    Metrics for TRAIN DataSet multi-class classification model
*-----------------------------------------------------------
    AccuracyMacro = 0.9603, a value between 0 and 1, the closer to 1, the better
    AccuracyMicro = 0.999, a value between 0 and 1, the closer to 1, the better
    LogLoss = 0.0015, the closer to 0, the better
    LogLoss for class 1 = 0, the closer to 0, the better
    LogLoss for class 2 = 0.088, the closer to 0, the better
    LogLoss for class 3 = 0.0606, the closer to 0, the better
************************************************************

Train DataSet Confusion Matrix
###############################


Confusion table
          ||========================================
PREDICTED ||  none | comp4 | comp1 | comp2 | comp3 | Recall
TRUTH     ||========================================
     none || 165 371 |     0 |     0 |     0 |     0 | 1.0000
    comp4 ||     0 |   772 |    16 |    25 |    11 | 0.9369
    comp1 ||     0 |     8 |   884 |    26 |     4 | 0.9588
    comp2 ||     0 |    31 |    22 | 1 097 |     8 | 0.9473
    comp3 ||     0 |    13 |     4 |     8 |   576 | 0.9584
          ||========================================
Precision ||1.0000 |0.9369 |0.9546 |0.9490 |0.9616 |
As can be seen the model predict the values correctly in most cases in the train data set. Now lets see how the model predict the data which have not been part of the raining process.
Model evaluation with test data set
//evaluate test set
var testPrediction = model.Transform(testData);
var metricsTest = mlContext.MulticlassClassification.Evaluate(testPrediction);
ConsoleHelper.PrintMultiClassClassificationMetrics("Test Dataset", metricsTest);

ConsoleHelper.ConsoleWriteHeader("Test DataSet Confusion Matrix ");
ConsoleHelper.ConsolePrintConfusionMatrix(metricsTest.ConfusionMatrix);
************************************************************
*    Metrics for Test Dataset multi-class classification model
*-----------------------------------------------------------
    AccuracyMacro = 0.9505, a value between 0 and 1, the closer to 1, the better
    AccuracyMicro = 0.9986, a value between 0 and 1, the closer to 1, the better
    LogLoss = 0.0033, the closer to 0, the better
    LogLoss for class 1 = 0.0012, the closer to 0, the better
    LogLoss for class 2 = 0.1075, the closer to 0, the better
    LogLoss for class 3 = 0.1886, the closer to 0, the better
************************************************************

Test DataSet Confusion Matrix
##############################


Confusion table
          ||========================================
PREDICTED ||  none | comp4 | comp1 | comp2 | comp3 | Recall
TRUTH     ||========================================
     none || 120 313 |     6 |    15 |     0 |     0 | 0.9998
    comp4 ||     1 |   552 |    10 |    17 |     4 | 0.9452
    comp1 ||     2 |    14 |   464 |    24 |    24 | 0.8788
    comp2 ||     0 |    39 |     0 |   835 |    16 | 0.9382
    comp3 ||     0 |     4 |     0 |     0 |   412 | 0.9904
          ||========================================
Precision ||1.0000 |0.8976 |0.9489 |0.9532 |0.9035 |
We can see, that the model has overall accuracy 99%, and 95% average per class accuracy.
The complete nptebook of this blog post can be found here.


 .
.